Analytics & Reporting
Every post-purchase number, measured.
Dashboards for returns, warranties, registrations, and shipping protection. All across multiple distinct panels, financial drill-downs that break every claim into credits and deductions, saved filter views shared across your team, and scheduled exports that arrive in your inbox on whatever cadence you set.
Dashboards
Every dashboard, one location.
Returns, warranties, registrations, and shipping protection all get purpose-built panels, all reachable from a single dashboard menu. Here's a few of them, and what each one answers.
Returns
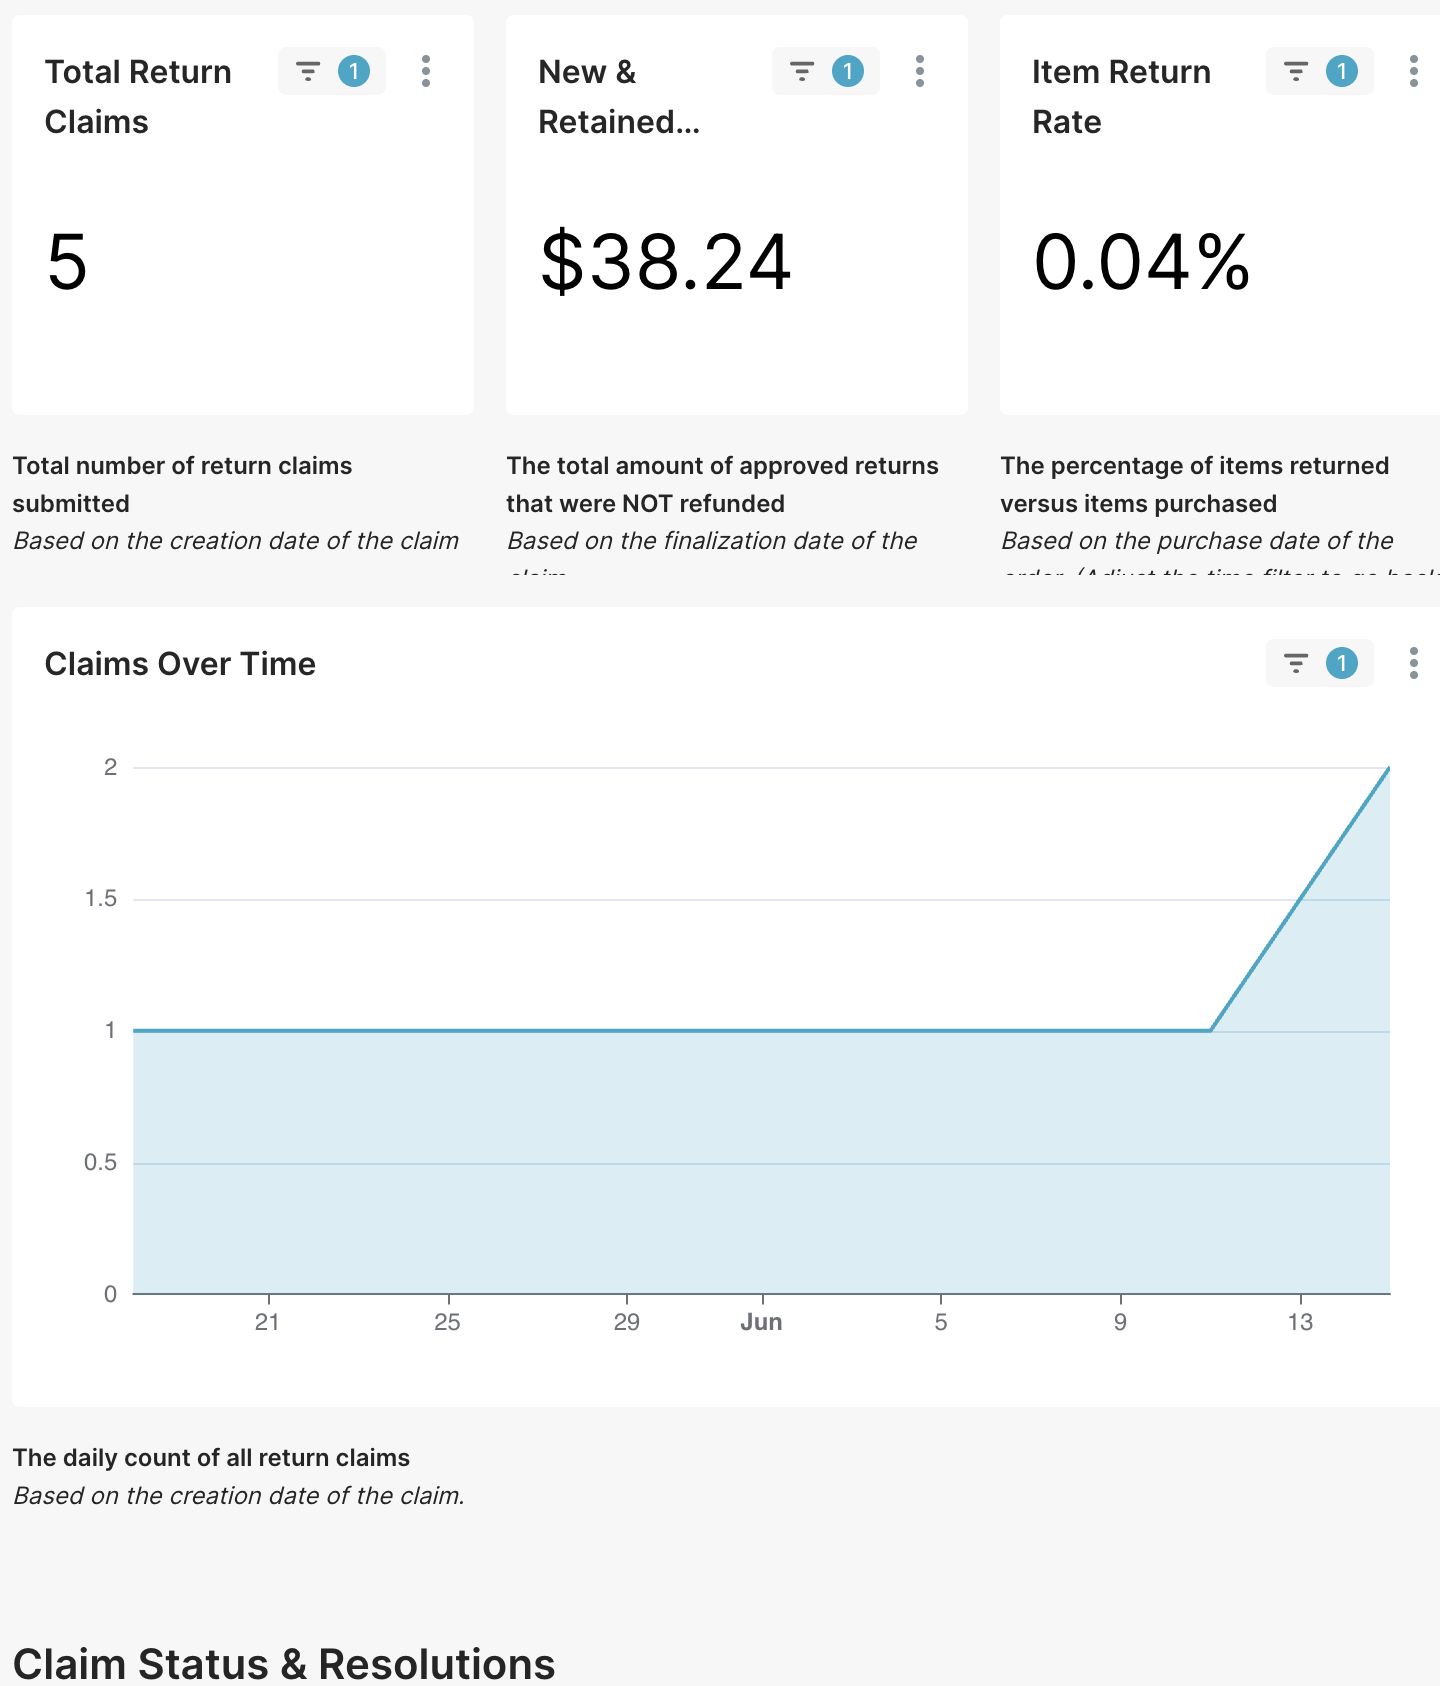
Return Overview
Total claims, revenue saved, return rate, and resolution breakdowns at a glance.
Return Operations
Timeline and efficiency metrics: claim volume, transit times, and refund exposure.
Return Products
Product-specific data: finalized item counts, pricing, and variant-level analysis.
Return Rate
Items returned versus sold, with trends across products and variants.
Return Reasons
Why customers return, in word clouds and sunbursts, linked to resolutions.
Return Revenue
The financial side of returns: revenue saved, refunded, and recovered over time.
Return Inspections
Inspection volumes and quality grades, and how grades drive resolutions.
Return Table
Flexible, filterable, exportable item-level reporting.
Warranties
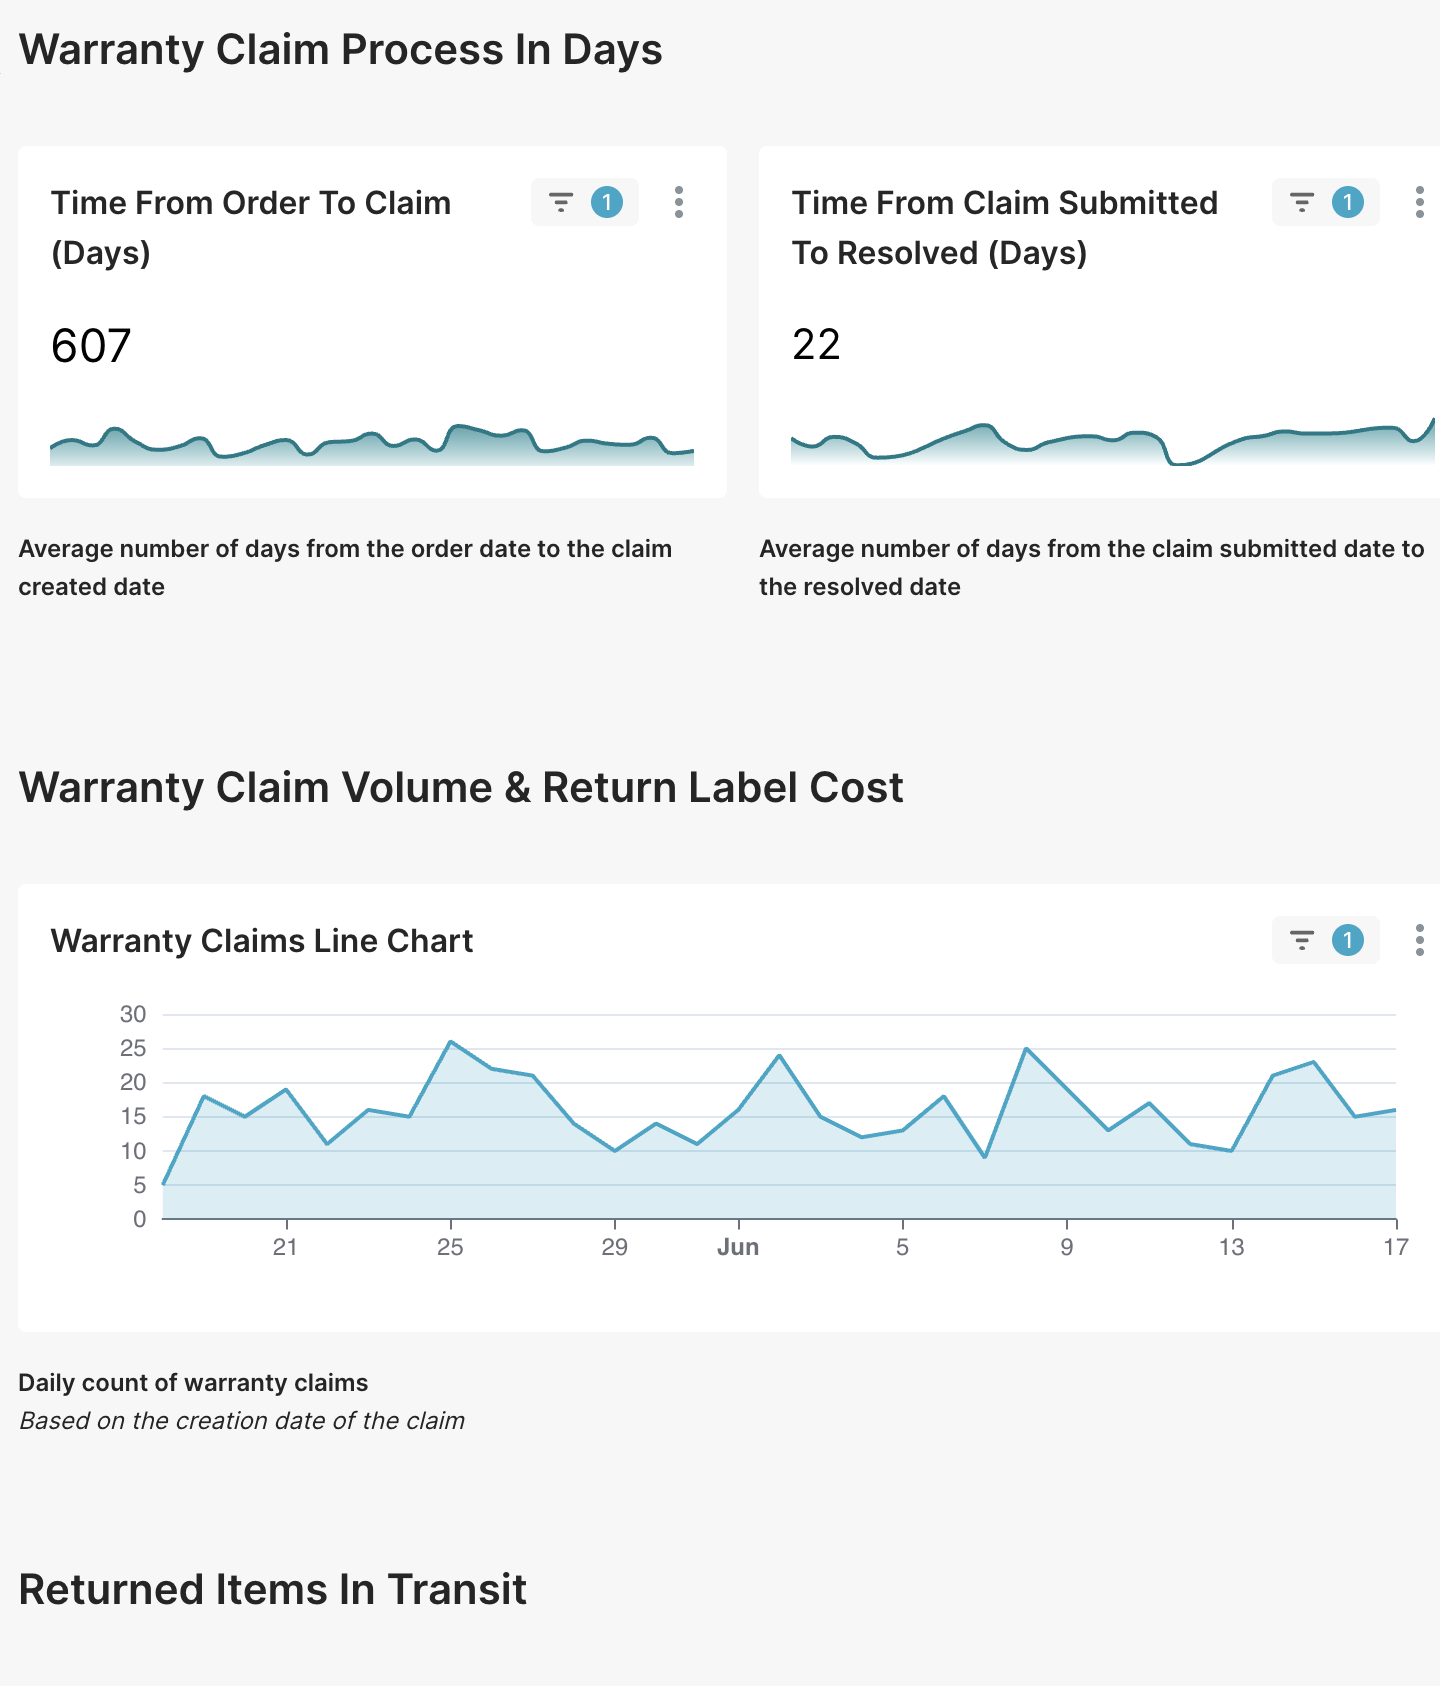
Warranty Operations
Program performance at a glance: time, volume, cost, and status.
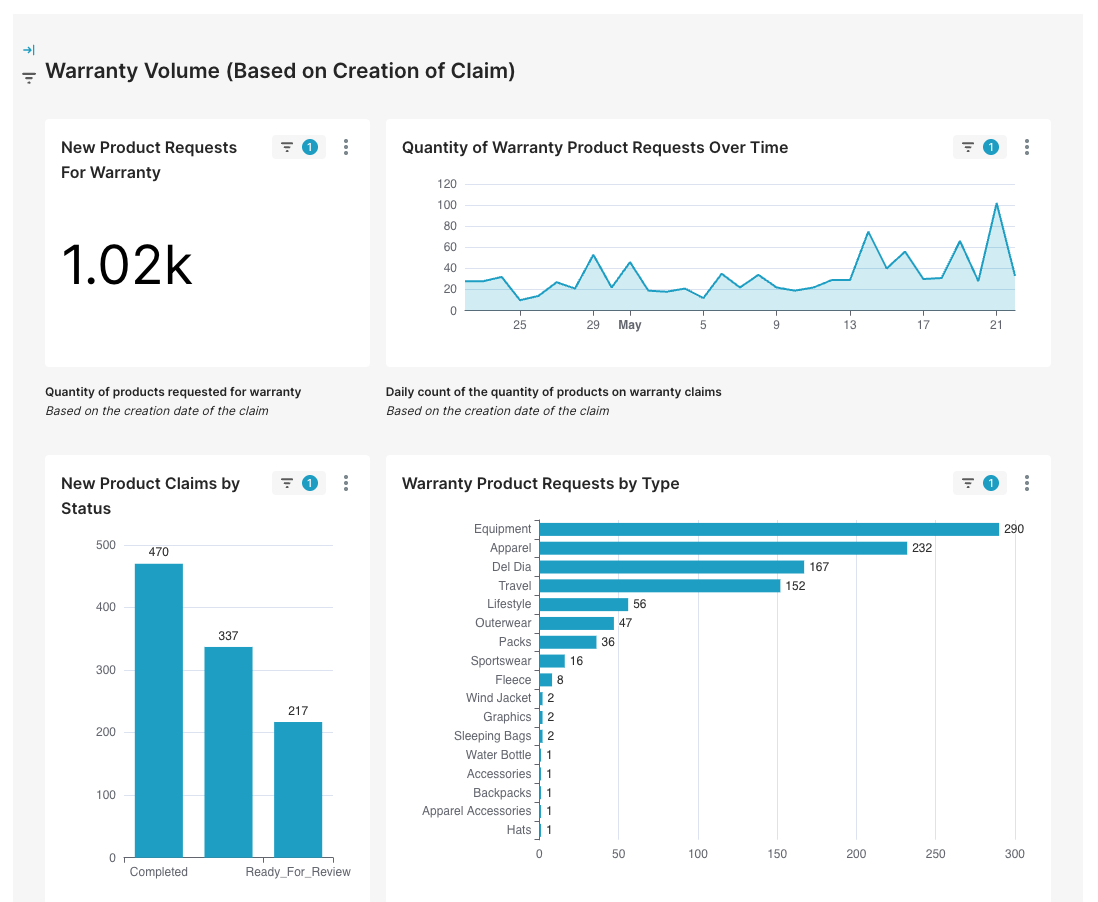
Warranty Overview
Claimed products over time, by status and product type.
Warranty Products
Daily claim breakdowns and cost totals by product name and variant.
Warranty Reasons
Why claims are filed, by product type and line item.
Registrations
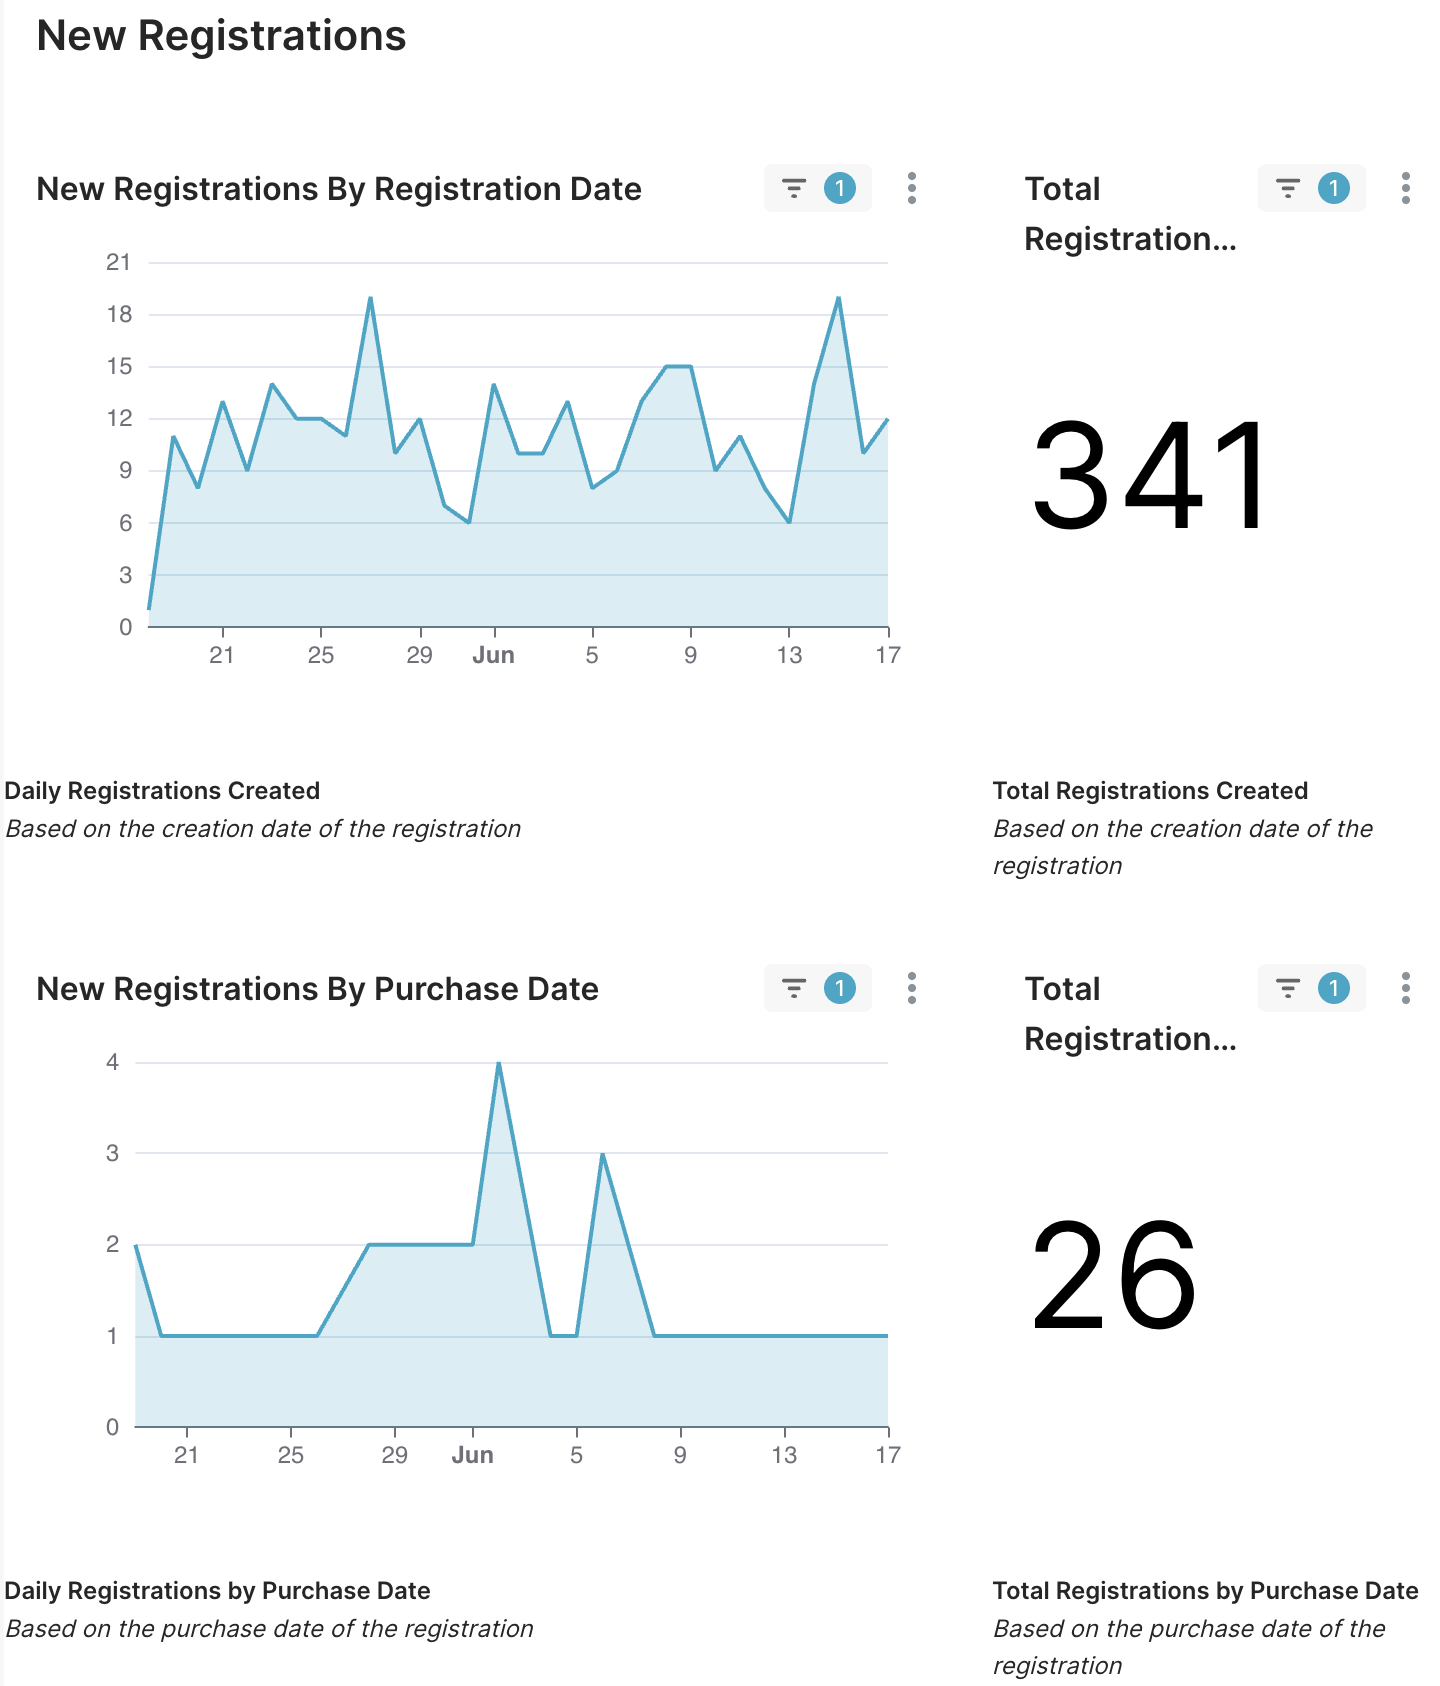
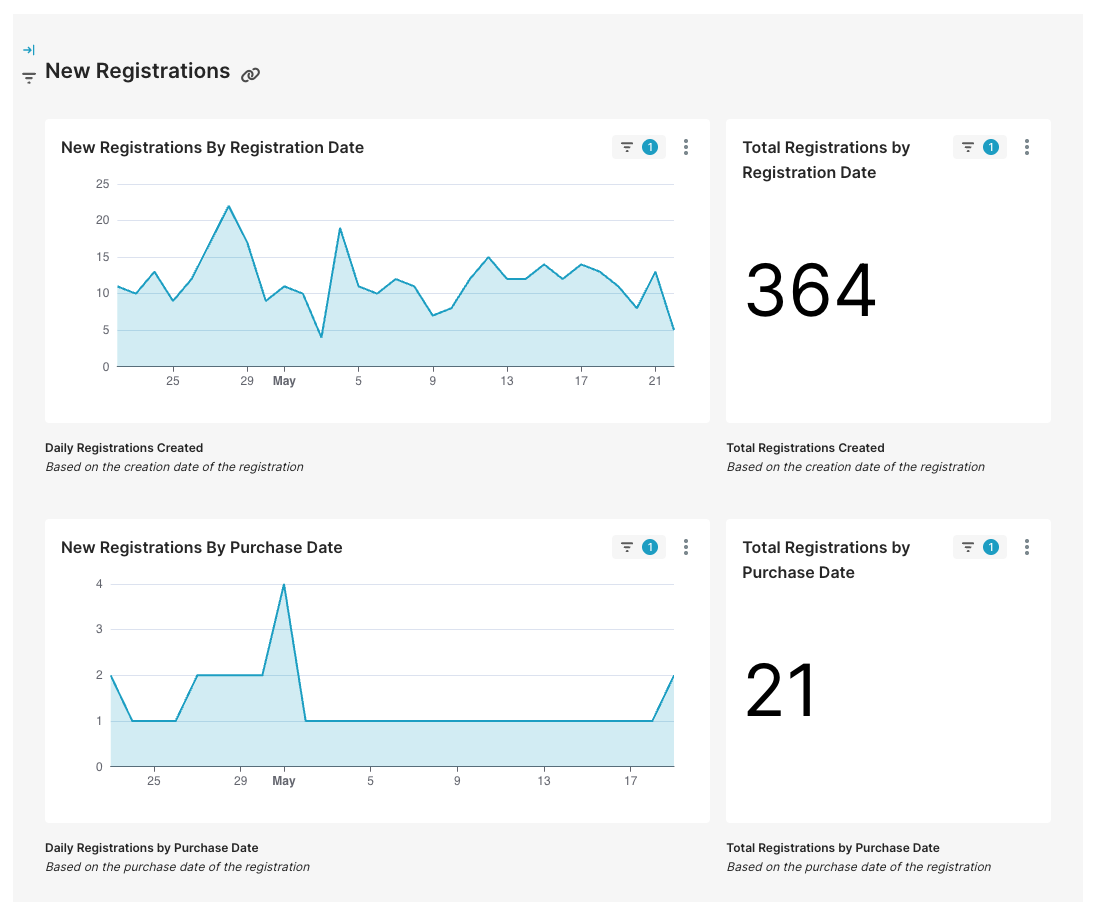
Registration Overview
New and total registrations over time, by sales channel and purchase date, with the top registered products.
Warranties from Registrations
How many registrations convert to warranty claims, by channel and product.
Product Registrations Table
Every registered product, down to the variant.
Shipping Protection
Shipping Protection
Protected orders, claims filed, claim outcomes, and resolution mix, live.
Warranties & Registrations
The full lifecycle, not just returns.
Warranty and registration analytics are built in with the same depth of treatment as returns, shipping protection, or any other part of the platform. This allows the post-purchase picture to extend across every part of every program you run with Warranties & Registration. It allows everything to be linked and measured together.

Warranty Dashboards
Warranties in first class
Four named panels make up the warranty dashboards. The Operations panel tracks cycle times from order to claim to resolution, label costs, and items in transit. The Overview panel shows claim quantities over time, by status, by product type, and the top products with approved warranties.
The Products panel breaks down daily claims by submitted versus finalized, with totals and costs by product type, name, and variant. And the Reasons panel surfaces the most common failure patterns, cross-referenced by product type.
Registration Dashboards
Registration overviews and details
New registrations over time, by sales channel, and by purchase date; with cumulative trends, top 10 registered products, and a variant-level registrations table. Filter by product, channel, and date range.
The standout metric: warranties filed from registrations, by channel, product, and overall. No standalone registration or warranty tool can produce it, because no standalone tool has both datasets.
Warranties filed from registrations connects two normally distinct parts of your post-purchase program, showing whether registrations are driving claims or providing warranty data. It's only possible because both programs live on one platform.
Shipping Protection
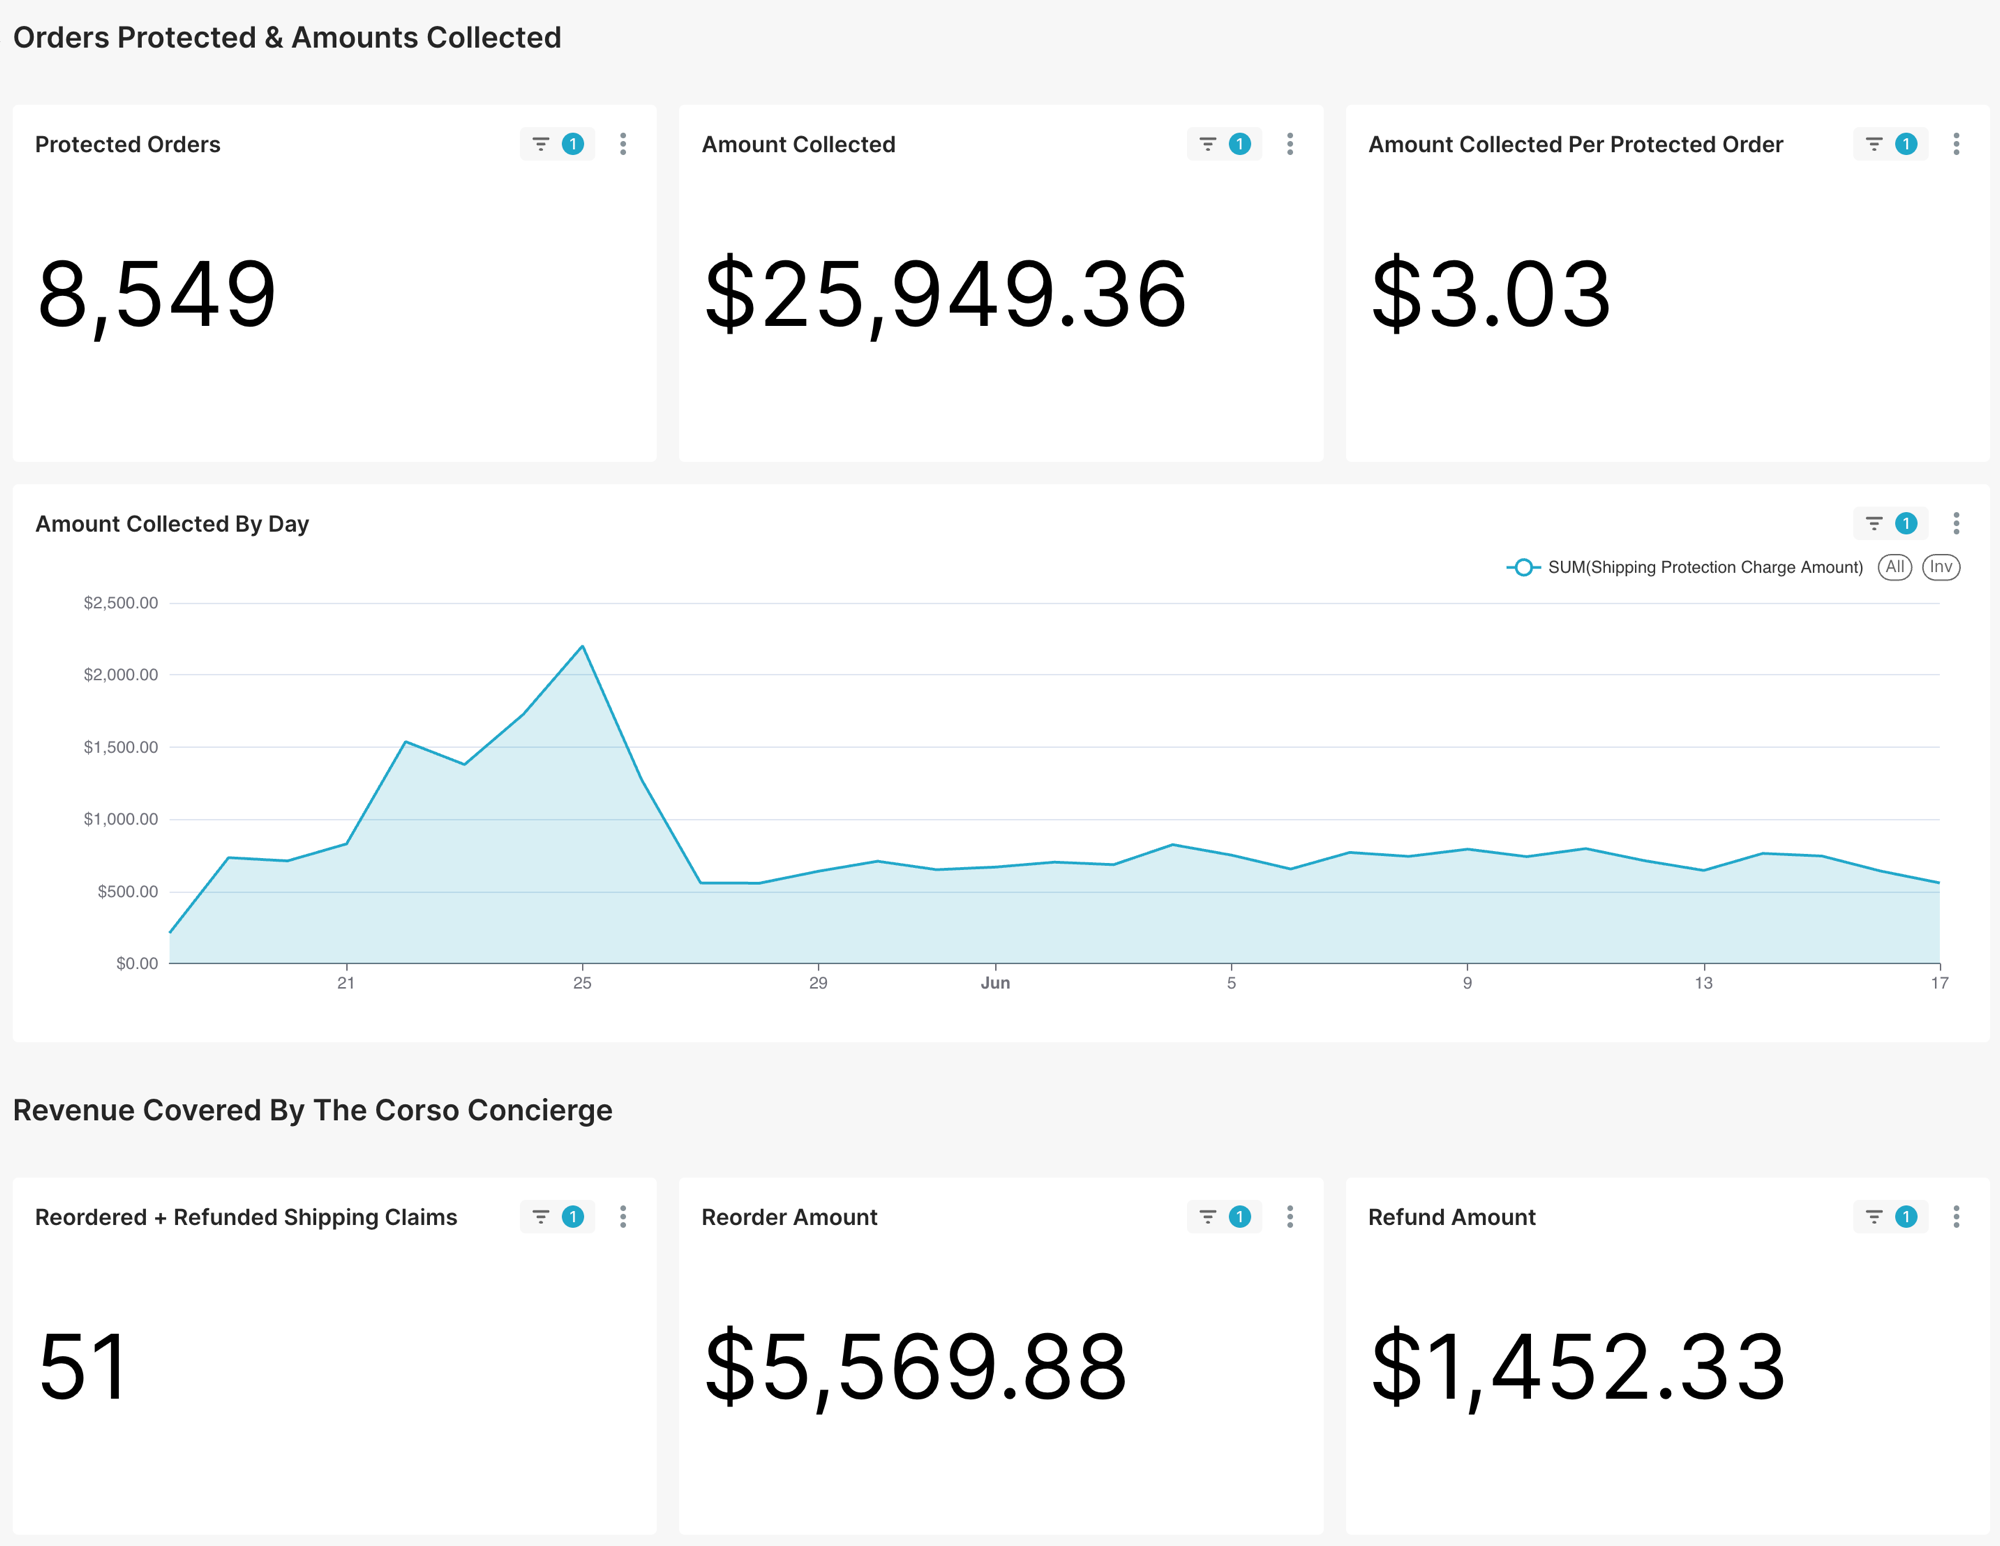
Protection program stats, live.
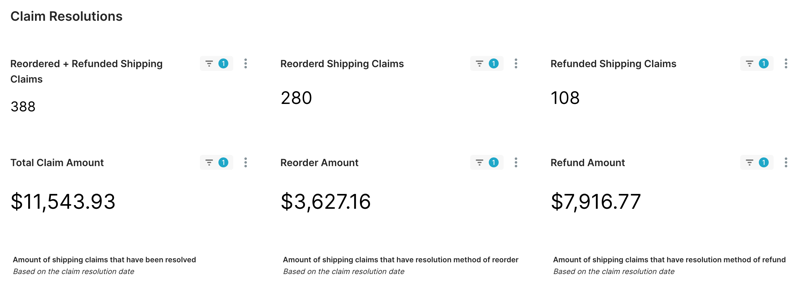
Live dashboards track protected order volume, claims filed against protected orders, claim outcomes split across reorders, refunds, and gift cards, resolution times, and the sustainability metrics behind Shipping Protection.
For you and your finance team, it's visibility into whether the program is performing. For merchants using Corso Concierge, it's also a window into how claims are being resolved on your behalf.
Financial Analytics
The financial picture, claim by claim.
This is the layer for finance teams: what the returns program retains, what it generates, and where every dollar moves inside every claim.
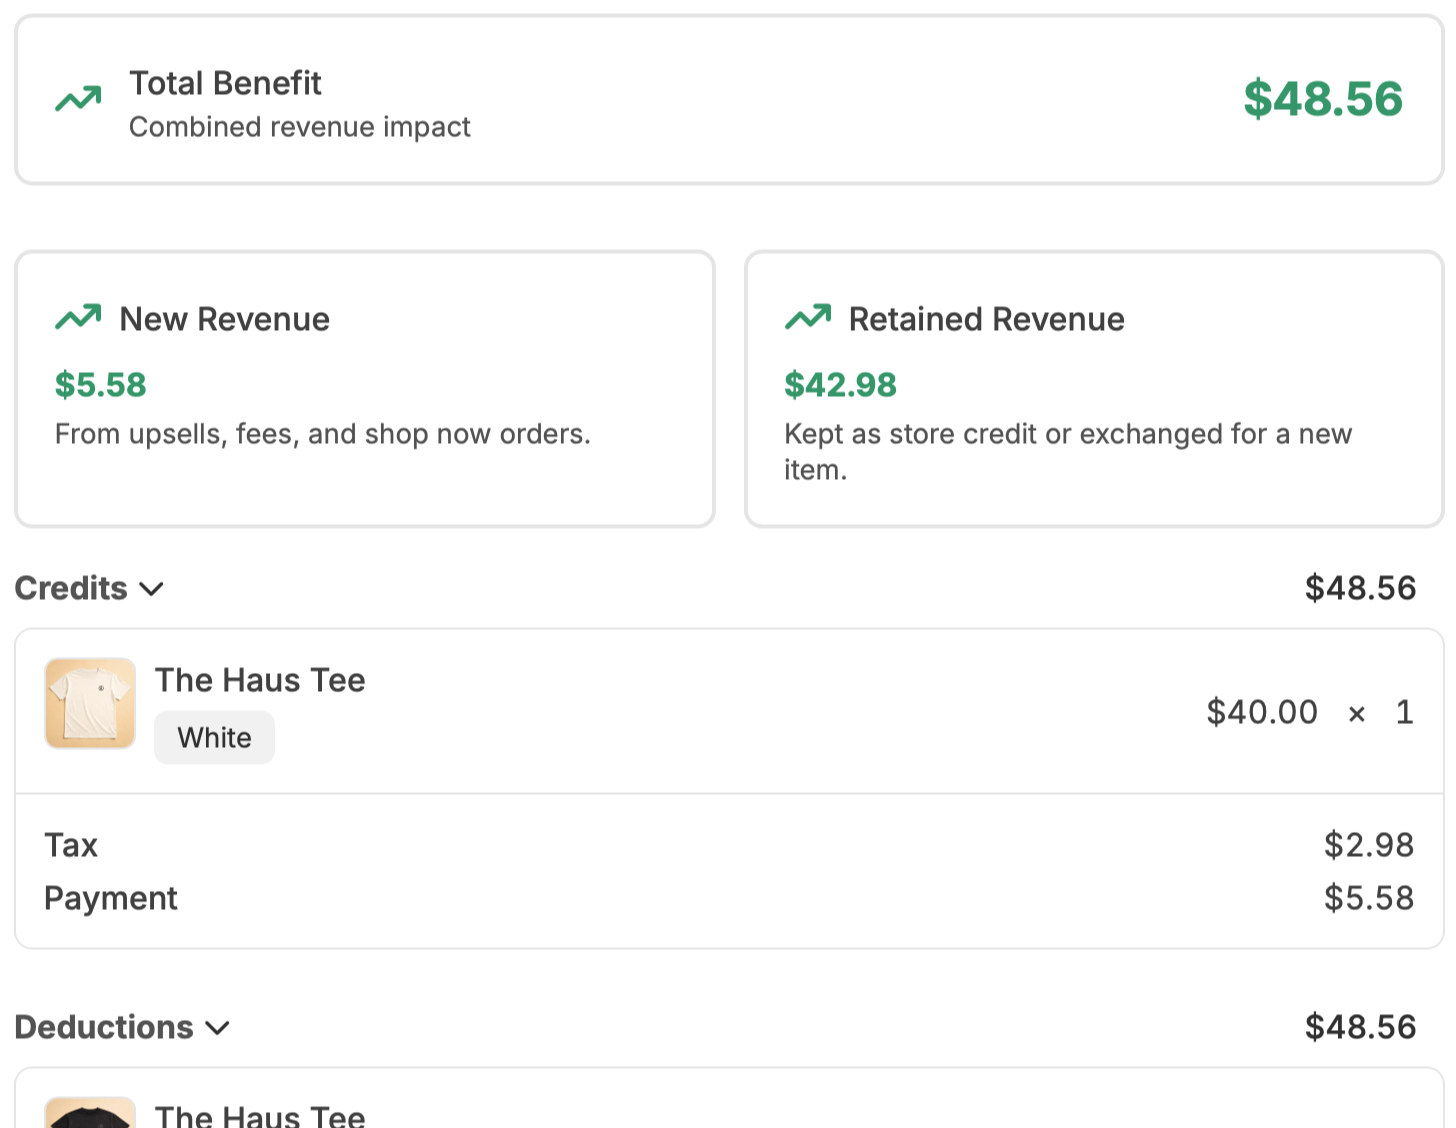
Get to the financial heart of the matter by analyzing the protection fees collected at checkout on one side, and the reorders and refunds Concierge covers when a shipment goes wrong on the other. The returns program tells the same story from a different angle. Every claim either retains revenue or generates new revenue, and Claim Benefit rolls both into a single number.
Retained
Revenue kept through exchanges, gift cards, and Shop Now instead of refunds
New
Additional revenue when Shop Now purchases exceed the return credit
Combined
Total claim benefit: the returns program as a retention engine, quantified
The Returns Ledger
Every claim breaks into credits (returned item value, taxes, customer payments), deductions (replacement items, handling fees, exchange shipping), and resultant balance.
Each claim also carries a real-time financial summary. When a customer can choose between a refund and a gift card with a bonus, both options show side by side, for the customer and for your agents.
Every customer. Every claim. One view.
Each customer profile consolidates their full history across returns, warranties, and shipping protection, with claim counts that navigate straight to the details. Agents get instant context, and fraud patterns that hide program-by-program become visible in combination.
Operational Tooling
Save it, schedule it, share it.
Saved views and scheduled exports are what separate production analytics infrastructure from a set of pretty charts. Dashboards answer the question in front of you; reporting is how a team turns that into a repeatable workflow. The right slice of data gets saved once and delivered on a schedule, so the numbers reach finance, merchandising, and ops without anyone remembering to pull a report.

Saved Views
Any filter set, one click away
Save any filter combination across returns, warranties, registrations, and shipping protection as a reusable view: date ranges, status, shipment state, resolution method, tags, inspection status, and more. Views are shared with the whole team, with no limit.
Export Templates
Configure the export once
Choose exactly which columns appear, in what order, with what filters. Templates are reusable, so next month’s export runs without reconfiguring. Custom field responses flow into the data too.
Scheduled Exports
Data that delivers itself
Attach a template to a daily, weekly, or monthly schedule with automatic email delivery to multiple recipients. Finance gets the ledger every Monday morning whether anyone logs in or not.
In-App Alerts
Know when it’s ready
The notification center tracks export completion with direct download links, plus system issues, configuration problems, and product updates. High-priority alerts surface anything needing immediate attention.
Example · scheduled export
Four export types cover the platform: returns, warranties, registrations, and shipping claims. Anything collected through custom fields rides along, so the data your automations gather never gets stranded in the admin.
The Platform Advantage
Measure, decide, automate, repeat.
Analytics in Corso aren't decorative. They're the feedback loop for the automation engine and the data layer the AI systems learn from.
Dashboards measure automation impact
Charge a handling fee on refunds to nudge exchanges, then watch the resolution mix, revenue retained, and return rate respond. The dashboards validate every policy decision made in the rules engine.
Exports feed external systems
Scheduled exports push Corso data into BI platforms, finance systems, or spreadsheets on a cadence. You’re never locked into our dashboards for analysis.
Sidekick is the conversational interface
"What was my return rate for Q1?" The AI assistant queries the same data layer the dashboards visualize and answers in plain language.
Exchange Recommendations learn from it
The AI exchange system trains on the same historical patterns the returns dashboards chart. Better data, better recommendations.